Build a Data Sculpture
Use physical craft materials to tell a data story in 3D
Set Up
This activity will take 20 to 30 minutes. You should have these materials on hand:
- Local craft materials (plastic bottle tops, wire, fuzzy balls, colored paper, wood blocks, construction paper)
- Tape, glue, scissors
- DO NOT include pens, crayons, or anything else to write with (otherwise people just draw instead of building)
- DO NOT include LEGO bricks (otherwise people just build bar charts)
Download and print the activity guide
 Going Virtual?
Make sure to post the PDF handouts to the in-session virtual chat, or have just one on-screen via screen-share while people build. Don’t email them in advance; this can give curious folks a bit too much time to consider the data.
Background
The idea of playing with data is new to most folks. This activity lets people quickly build sculptures that tell a simple data story with craft materials. The playful approach to the data helps engage the participants in thinking about how stories can be found and presented quickly, and helps people feel more freedom and flexibility about data presentations. It builds a notion of "presentation" instead of "visualization". The activity also builds the ability to translate words and numbers into structural forms. In addition, playing with these materials at the start of a workshop can break down power dynamics that might exist within the group.
This activity builds on the pedagogy and workshop style of the MIT Media Lab’s Lifelong Kindergarten Group (where Rahul got his Master’s degree). It also has connections to the participatory urban planning work of James Rojas.
Kick off the Activity
Introduce the group to two related “normal” charts of data. One can be a single fact, and the other a medium-sized set of information. If you make your own, be sure to avoid data that the audience knows too well - we find that leads people to get lost in the nuances and intimate details. We suggest using more generic or high-level data. Here are a few handouts you are welcome to download, print, and use:
Going Virtual?
Make sure to post the PDF handouts to the in-session virtual chat, or have just one on-screen via screen-share while people build. Don’t email them in advance; this can give curious folks a bit too much time to consider the data.
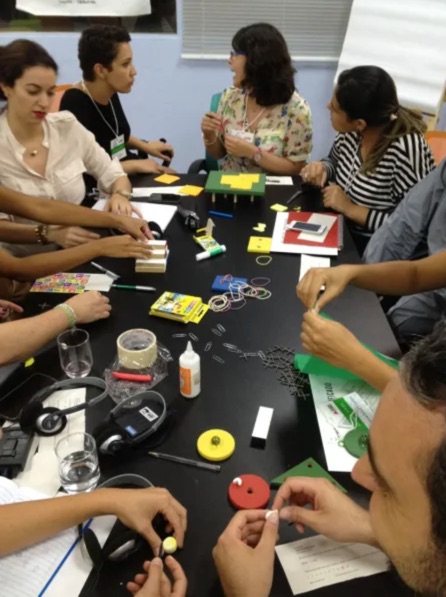
Ask the group to pair up, preferably with someone they don’t know. Show participants a large central table full of the materials you have gathered. Give them 6 minutes to quickly build a physical representation of the data you presented earlier. Don't give them too long, otherwise they will get stuck on nuances instead of just getting their creative juices flowing. Remind them they are creative, and that pipe cleaner bar charts are NOT allowed!
After 3 minutes tell them they should be building now; this is a 'think with your hands activity'. When they have one minute left let them know.
Going Virtual?
Have each person build their own sculpture with the materials they have gathered. Put on some background music to make the silent building time less awkward. Make sure to announce when folks have just one minute left.
Have Everyone Share Back
Stop everyone when the time is up. Give each group 1 minute to share what they made. You can summarize by pointing out similarities and differences in the pieces folks made. Often you’ll see some people focusing on one data point, while others look at a broader picture. With the happiness data, some people try to merge to two datasets, while others just focus on one. Point out any physical versions of traditional charts to point out how entrenched our current visual presentation techniques are! Try to identify patterns in how the numbers were mapped onto physical objects.